About the author

Ivan Listeš
Senior Software Engineer
ⓘ Note: The code for MLOps PoC is available here: link.
Introduction
Deployment to the dynamic world of cloud is not the latest news anymore. Accurate predictions of infrastructure usage and costs are no longer just an advantage; they’re essential. Organizations adopt their multi-cloud strategies, forecast consumption and optimize expenses. The process of these forecasts and optimizations has become increasingly complex.
In this article and in the given PoC repository we introduce a self-correcting MLOps pipeline designed to tackle this challenge. The introduced pipeline leverages MLFlow from experiment tracking, artifact logging and model versioning, providing transparency throughout the model development lifecycle. The whole pipeline is seamlessly integrated with GitHubActions, which serve as CI/CD tooling to automate model training, deployment or updates.
Of course, the system is orchestrated by Kubernetes which traditionally provides containerized scalability and reliability, together with Helm for managing resources in a reusable and version-controlled manner. Monitoring is solved by Prometheus and Grafana visualizing the system’s operational and performance. We use Alertmanager to send Slack notifications for system degradation visibility. And finally, GitHub secrets are used to manage credentials for MLflow, Google Cloud, and Slack Webhooks, safeguarding sensitive infrastructure and data.
This MLOps ecosystem aims to provide a comprehensive solution for forecasting cloud usage, ensuring automation, reproducibility, observability, security and scalability in cloud-native environments.
Data collection (generation) and visualization
In the world of machine learning, everything starts with a good and valid dataset. If we fail at model generation and provide the wrong dataset, in the end we’ll suffer completely wrong results. Normally, you would collect the data for your project that you would have collected over the years.
Data collection refers to the process of gathering and assembling information, which can be quantitative (numerical data) or qualitative (descriptive data). Various techniques can be employed to collect data, such as surveys, interviews, observations, experiments, and accessing existing databases. The primary objective of data collection is to gather information that can be utilized for analysis, decision-making, and reporting.
For the purpose of this article, MLOps pipeline begins with the programmatic generation of structured data, simulating five years of historical cloud usage for various providers. This simulated data, encompassing key metrics like market share and revenue, is crucial for testing, simulation, and machine learning workflows.
We perform data generation using this script: generate_mock_data.py
When the data is generated we can easily use an interactive Streamlit application to visualise both simulated and predicted cloud service metrics. This dashboard provides a user-friendly interface to explore forecasts and real-time system metrics. Operational observability for these come via a lightweight Python metrics server.
In this particular case, the Streamlit application serves as a cloud provider analytics dashboard, built using Python, streamlit, plotly, and pandas. It visualizes both simulated and predicted cloud service metrics for providers like AWS, GCP, Azure, etc.
You can find the Streamlit code here: streamlit_app.py
Application packaging and deployment
In modern MLOps pipelines, the aspects of reliability, portability, and scalability are of the utmost importance. As applications grow more complex, spanning interactive dashboards (e.g. Streamlit), monitoring tools (like Prometheus and Grafana), model tracking services (such as MLflow), and reverse proxies (for instance, NGINX) a robust deployment strategy is crucial.
This is where containerization with Docker becomes important, while Kubernetes, as the container orchestration platform, manages the declarative configuration and orchestration of all application deployments, defining the desired state of resources and ensuring consistency, repeatability, and resilience.
Helm further streamlines this process by templating configurations and bundling resources into reusable charts, enabling version-controlled rollouts and simplified updates.
Application packaging and deployment resources:
- Dockerfile used for:
- generating the data,
- forecasting model,
- running Streamlit, and
- exposing metric using Prometheus scripts.
- Kubernetes manifest collection
- Helm application charts
Data version control (DVC)
DVC (Data Version Control) is an open-source version control system designed to manage machine learning projects. More specifically, it targets the challenges of versioning data, models, and experiment areas where traditional version control systems like Git may not suffice.
DVC enhances Git by providing version control capabilities for large datasets, machine learning models, and metrics, without overwhelming the Git repository. Instead of directly storing data within Git, DVC tracks metadata and retains the actual data in remote storage solutions (for instance, Google Cloud Storage, S3, etc.).
It is used to monitor versions of data or models by creating a lightweight text file that contains metadata pointing to a specific version of the data or model. These compact files are stored in Git alongside the code, and they are utilized each time to retrieve a specific version of the dataset from remote storage. Consequently, both the code and DVC metafiles are tracked using Git, while the actual data and models are preserved in remote storage.
The primary objectives of DVC include:
- Tracking and versioning large files (datasets, models) in conjunction with code
- Ensuring the reproducibility of experiments
- Facilitating collaboration among machine learning and data science teams
- Automating pipelines for training, evaluation, and deployment.
Git and DVC integration visualization:
DVC can significantly improve data science and machine learning projects in several specific areas, such as experiments where it enables users to track the precise evolution of data and models over time.
By ensuring that all team members utilize the same data versions, DVC eliminates confusion and reduces wasted time. Additionally, it facilitates the capture of the exact data and model versions employed in experiments, thereby simplifying the process of reproducing those experiments in the future.
Reproducibility is a cornerstone of effective MLOps. Data Version Control ensures that every iteration of the data and models is traceable and can be reproduced, which is essential for consistent retraining and collaborative experimentation. DVC integrates seamlessly with Google Cloud Storage for dependable and reproducible storage of these versioned assets.
Integrating DVC with cloud forecasting application
DVC can be installed on Windows, Linux, macOS or used as Visual Studio Extension.
In mlops-poc directory, where all changes are placed, initialize the DVC by utilizing the following command inside the Git project:
$ dvc init
Initialized DVC repository.
This initializes the DVC files (.dvc directory). File dvc.yaml defines stages, parameters, metrics, and plots. Stages form the pipeline(s) of a project, and parameters, metrics, and plots are used to evaluate and compare project versions and may be defined within stages or independently.
Newly created file can be added to Git, by utilizing command provided below:
$ git status
Changes to be committed:
        new file:   .dvc/.gitignore
        new file:   .dvc/config
        ...
Next step is to track the necessary data (for instance, .csv and .pkl files or all of the listed files), but to keep it simple cloud_provider_mock_data.csv will be used:
$ dvc add data/cloud_provider_mock_data.csvDVC stores information about the added file in a dvc file named data/cloud_provider_mock_data.csv.dvc. This small, human-readable metadata file acts as a placeholder for the original data for the purpose of Git tracking.
Next, run the following commands to track changes in Git:
$ git add data/cloud_provider_mock_data.csv.dvc data/.gitignore
$ git commit -m "Add cloud provider mock data"
Now the metadata about data is versioned alongside source code, while the original data file was added to .gitignore.
Before uploading data, configure the remote storage. DVC provides multiple storage types, such as Amazon S3, Microsoft Azure Blog Storage, Google Cloud Storage, etc.
In this example, we will use Google Cloud Storage. We start with the dvc remote add command, where name and a valid Cloud Storage URL is provided:
$ dvc remote add -d <REMOTE_NAME> gs://<BUCKET_NAME>Where <REMOTE_NAME> is the name of remote access (defined by user), and <BUCKET_NAME> is the name of the existing storage bucket.
To access Google Cloud Storage users must have correct permissions, so create a Service Account in GCP following provided steps:
# Set GCP project
$ gcloud config set project <PROJECT_ID>

# Create the service account
$ gcloud iam service-accounts create <SA_NAME> --description="Service account for DVC" --display-name="DVC Service Account"

# Assign permissions to access GCS (roles/storage.admin or more restrictive roles/storage.objectAdmin)
$ gcloud projects add-iam-policy-binding <PROJECT_ID> --member="serviceAccount:<SA_NAME>@<PROJECT_ID>.iam.gserviceaccount.com" --role="roles/storage.objectAdmin"

# Generate and download the key (saves the key to ~/sa-dvc-key.json.)
$ gcloud iam service-accounts keys create ~/sa-dvc-key.json --iam-account=<SA_NAME>@<PROJECT_ID>.iam.gserviceaccount.com
Once the ServiceAccount key is downloaded, set the credentials in the shell session, by utilizing the command provided below:
$ export GOOGLE_APPLICATION_CREDENTIALS=~/sa-dvc-key.jsonInclude the downloaded key file to authenticate, by utilizing the the command provided below:
$ dvc remote modify <REMOTE_NAME> credentialpath ~/sa-dvc-key.jsonOnce a remote storage is configured, utilize the following command to upload data:
$ dvc pushOnce DVC-tracked data and models are stored remotely, they can be downloaded when needed by using the command provided below:
$ dvc pullMonitoring and observability
A comprehensive monitoring and observability stack is important for maintaining the health and performance of the MLOps system.
In this example and article we use Prometheus, which is a time-series database tailored for monitoring and alerting. It is utilized to collect both system-level and application-specific metrics, providing a granular view of the pipeline’s operation.
These metrics are then visualized through Grafana dashboards, offering real-time insights into system health and model performance.
To ensure proactive issue detection, Alertmanager is linked to Prometheus, dispatching Slack notifications when predefined performance thresholds are breached. This allows for swift responses to potential issues and maintains the reliability of the forecasting models. Prometheus settings and alerting rules in the k8s manifest for Prometheus config map: prometheus-configmap.yaml
Security and access control
Their main objective is to safeguard sensitive data, maintain system integrity, and enforce appropriate usage policies. In the absence of effective access control, unauthorized individuals may gain entry to critical resources, resulting in data breaches, service interruptions, or system manipulation.
The implementation of security measures, such as authentication, role-based access control (RBAC), encryption, network policies, and secret management ensures that only trusted entities can engage with specific components or datasets.
In conclusion, strong security not only protects systems but also fosters trust among users, stakeholders, and regulatory authorities.
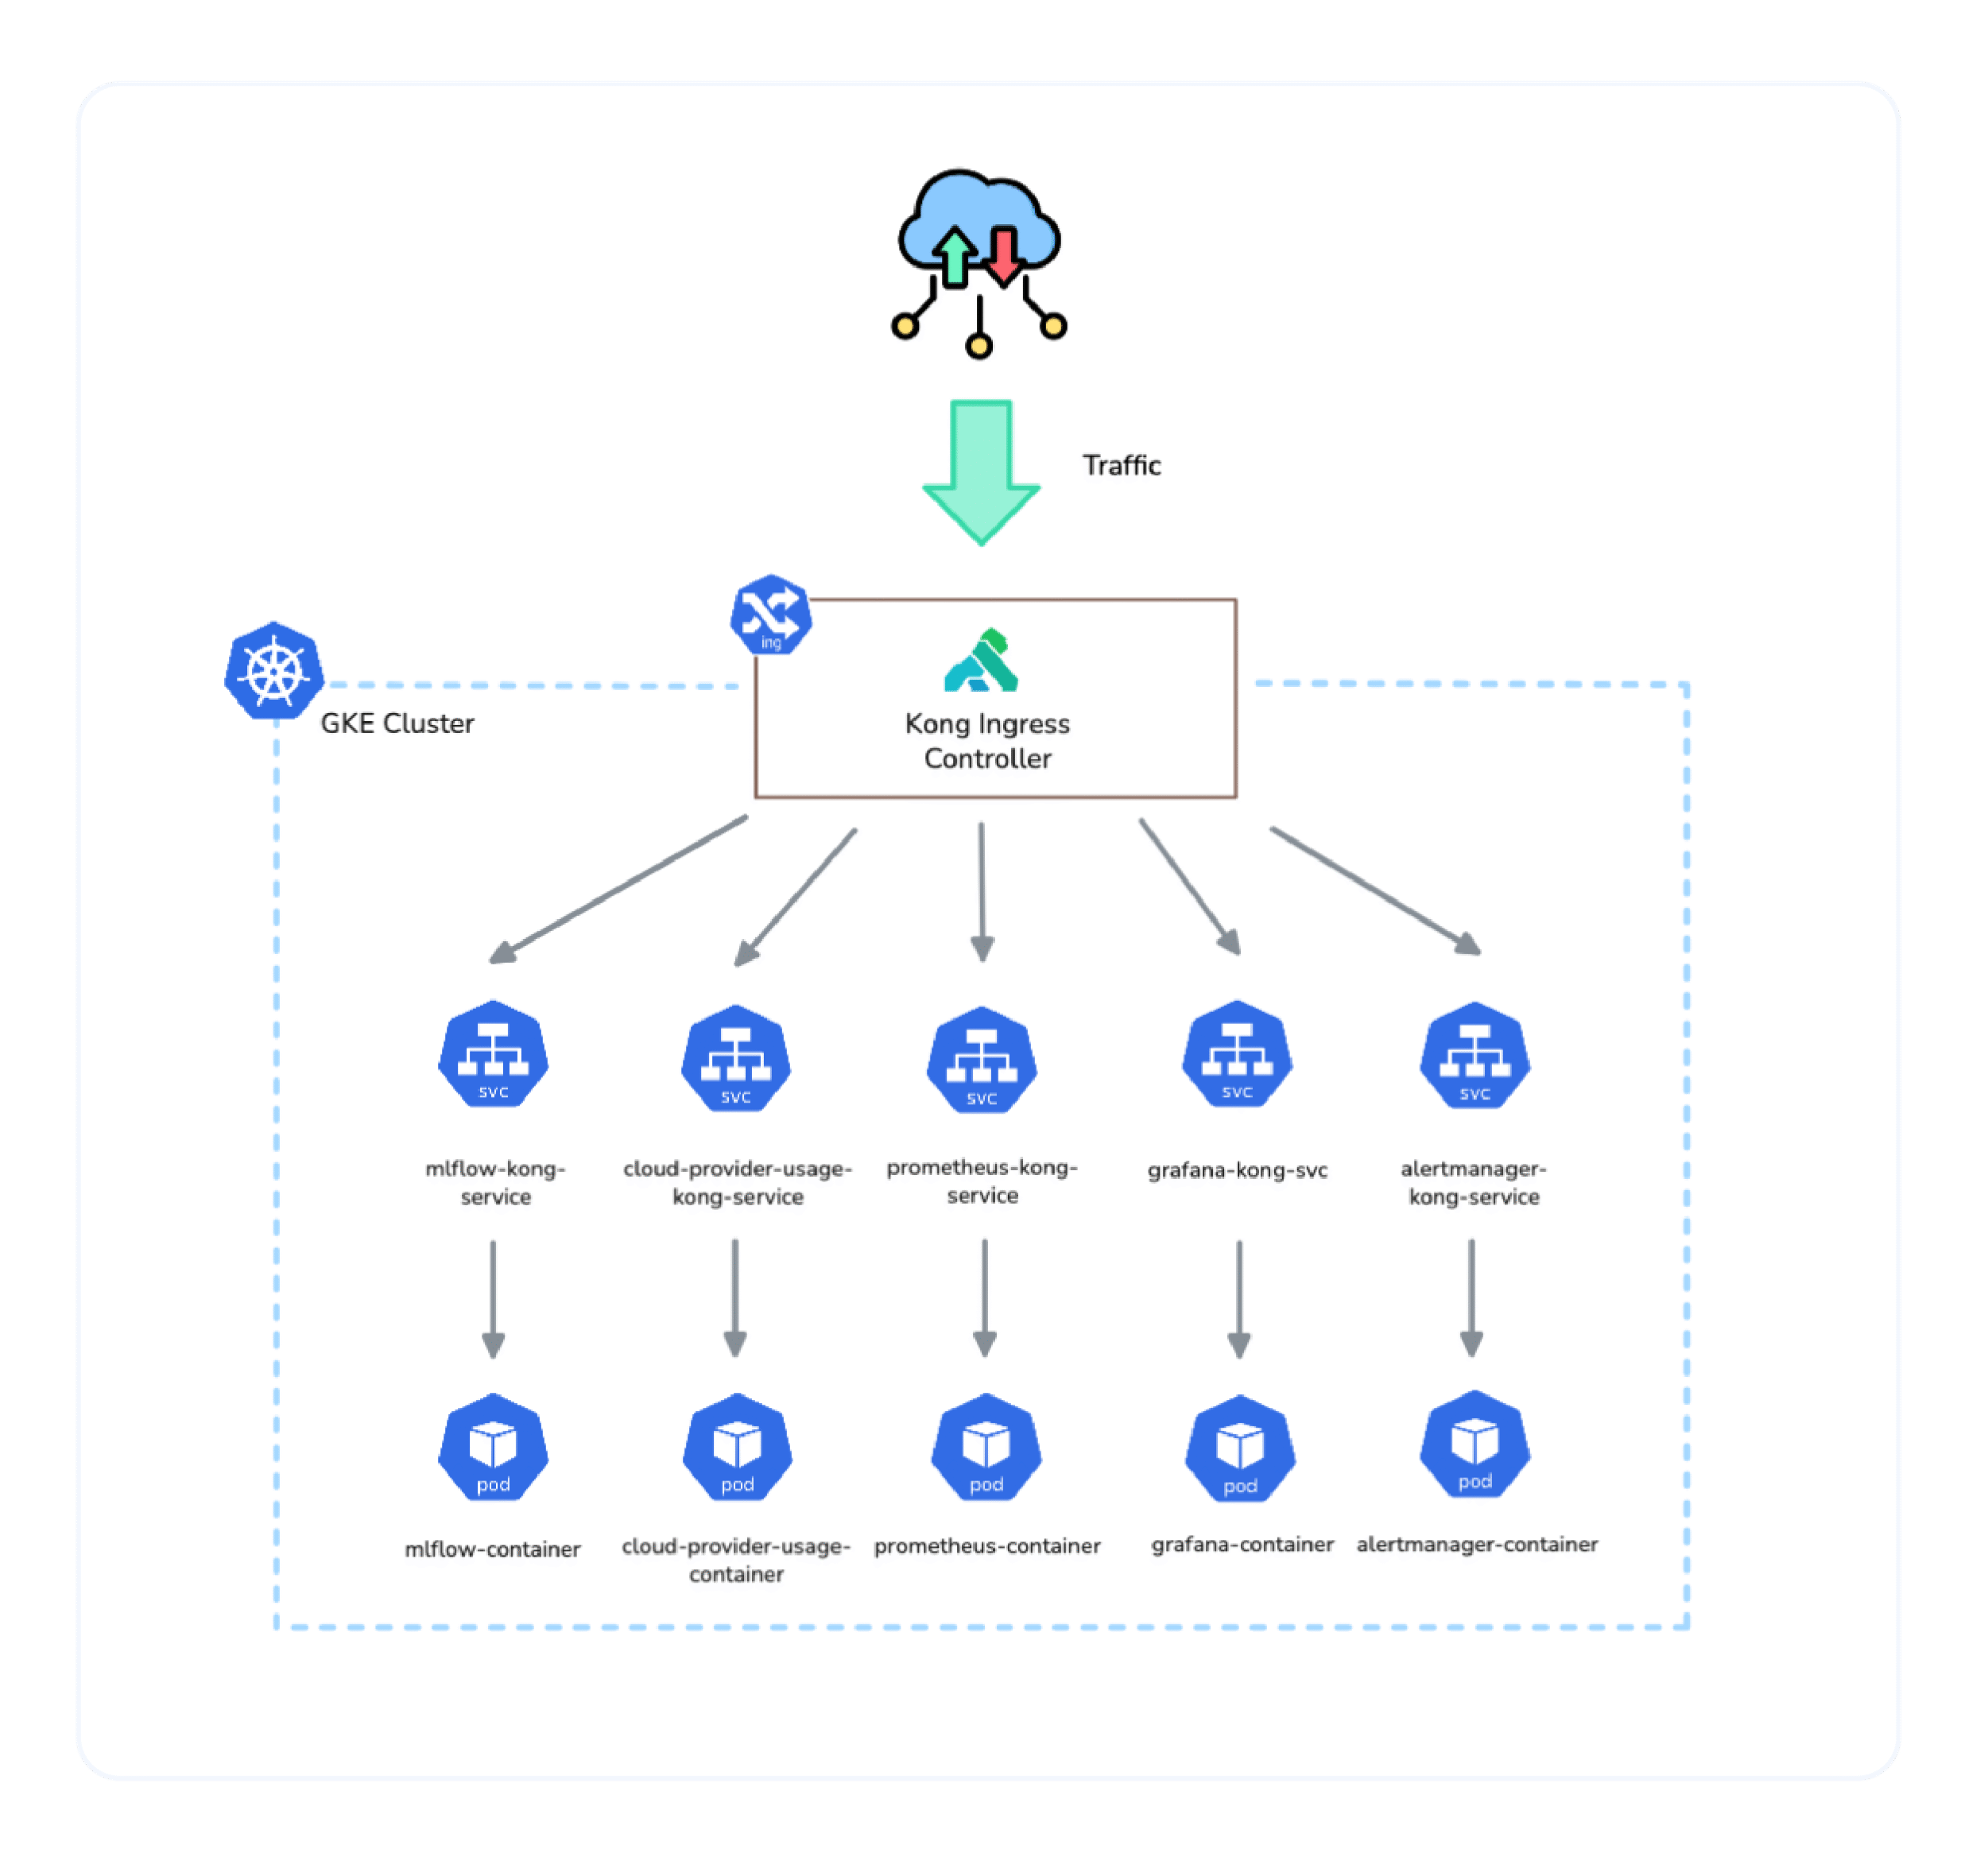 Figure: Kong Ingress controller workflow
Check out the ingress manifest definition: k8-ingress.yaml
Model development and logging
Model development and logging are foundational pillars of any robust Machine Learning Operations (MLOps) pipeline.
MLflow is a robust open-source platform designed to oversee the entire machine learning lifecycle, from experiment tracking and reproducibility to model packaging, deployment, and registry. In modern MLOps pipelines, where models are rapidly developed and experimentation is constant, MLflow plays a central role in providing structure, visibility, and automation to what would otherwise be an unstructured and error-prone process.
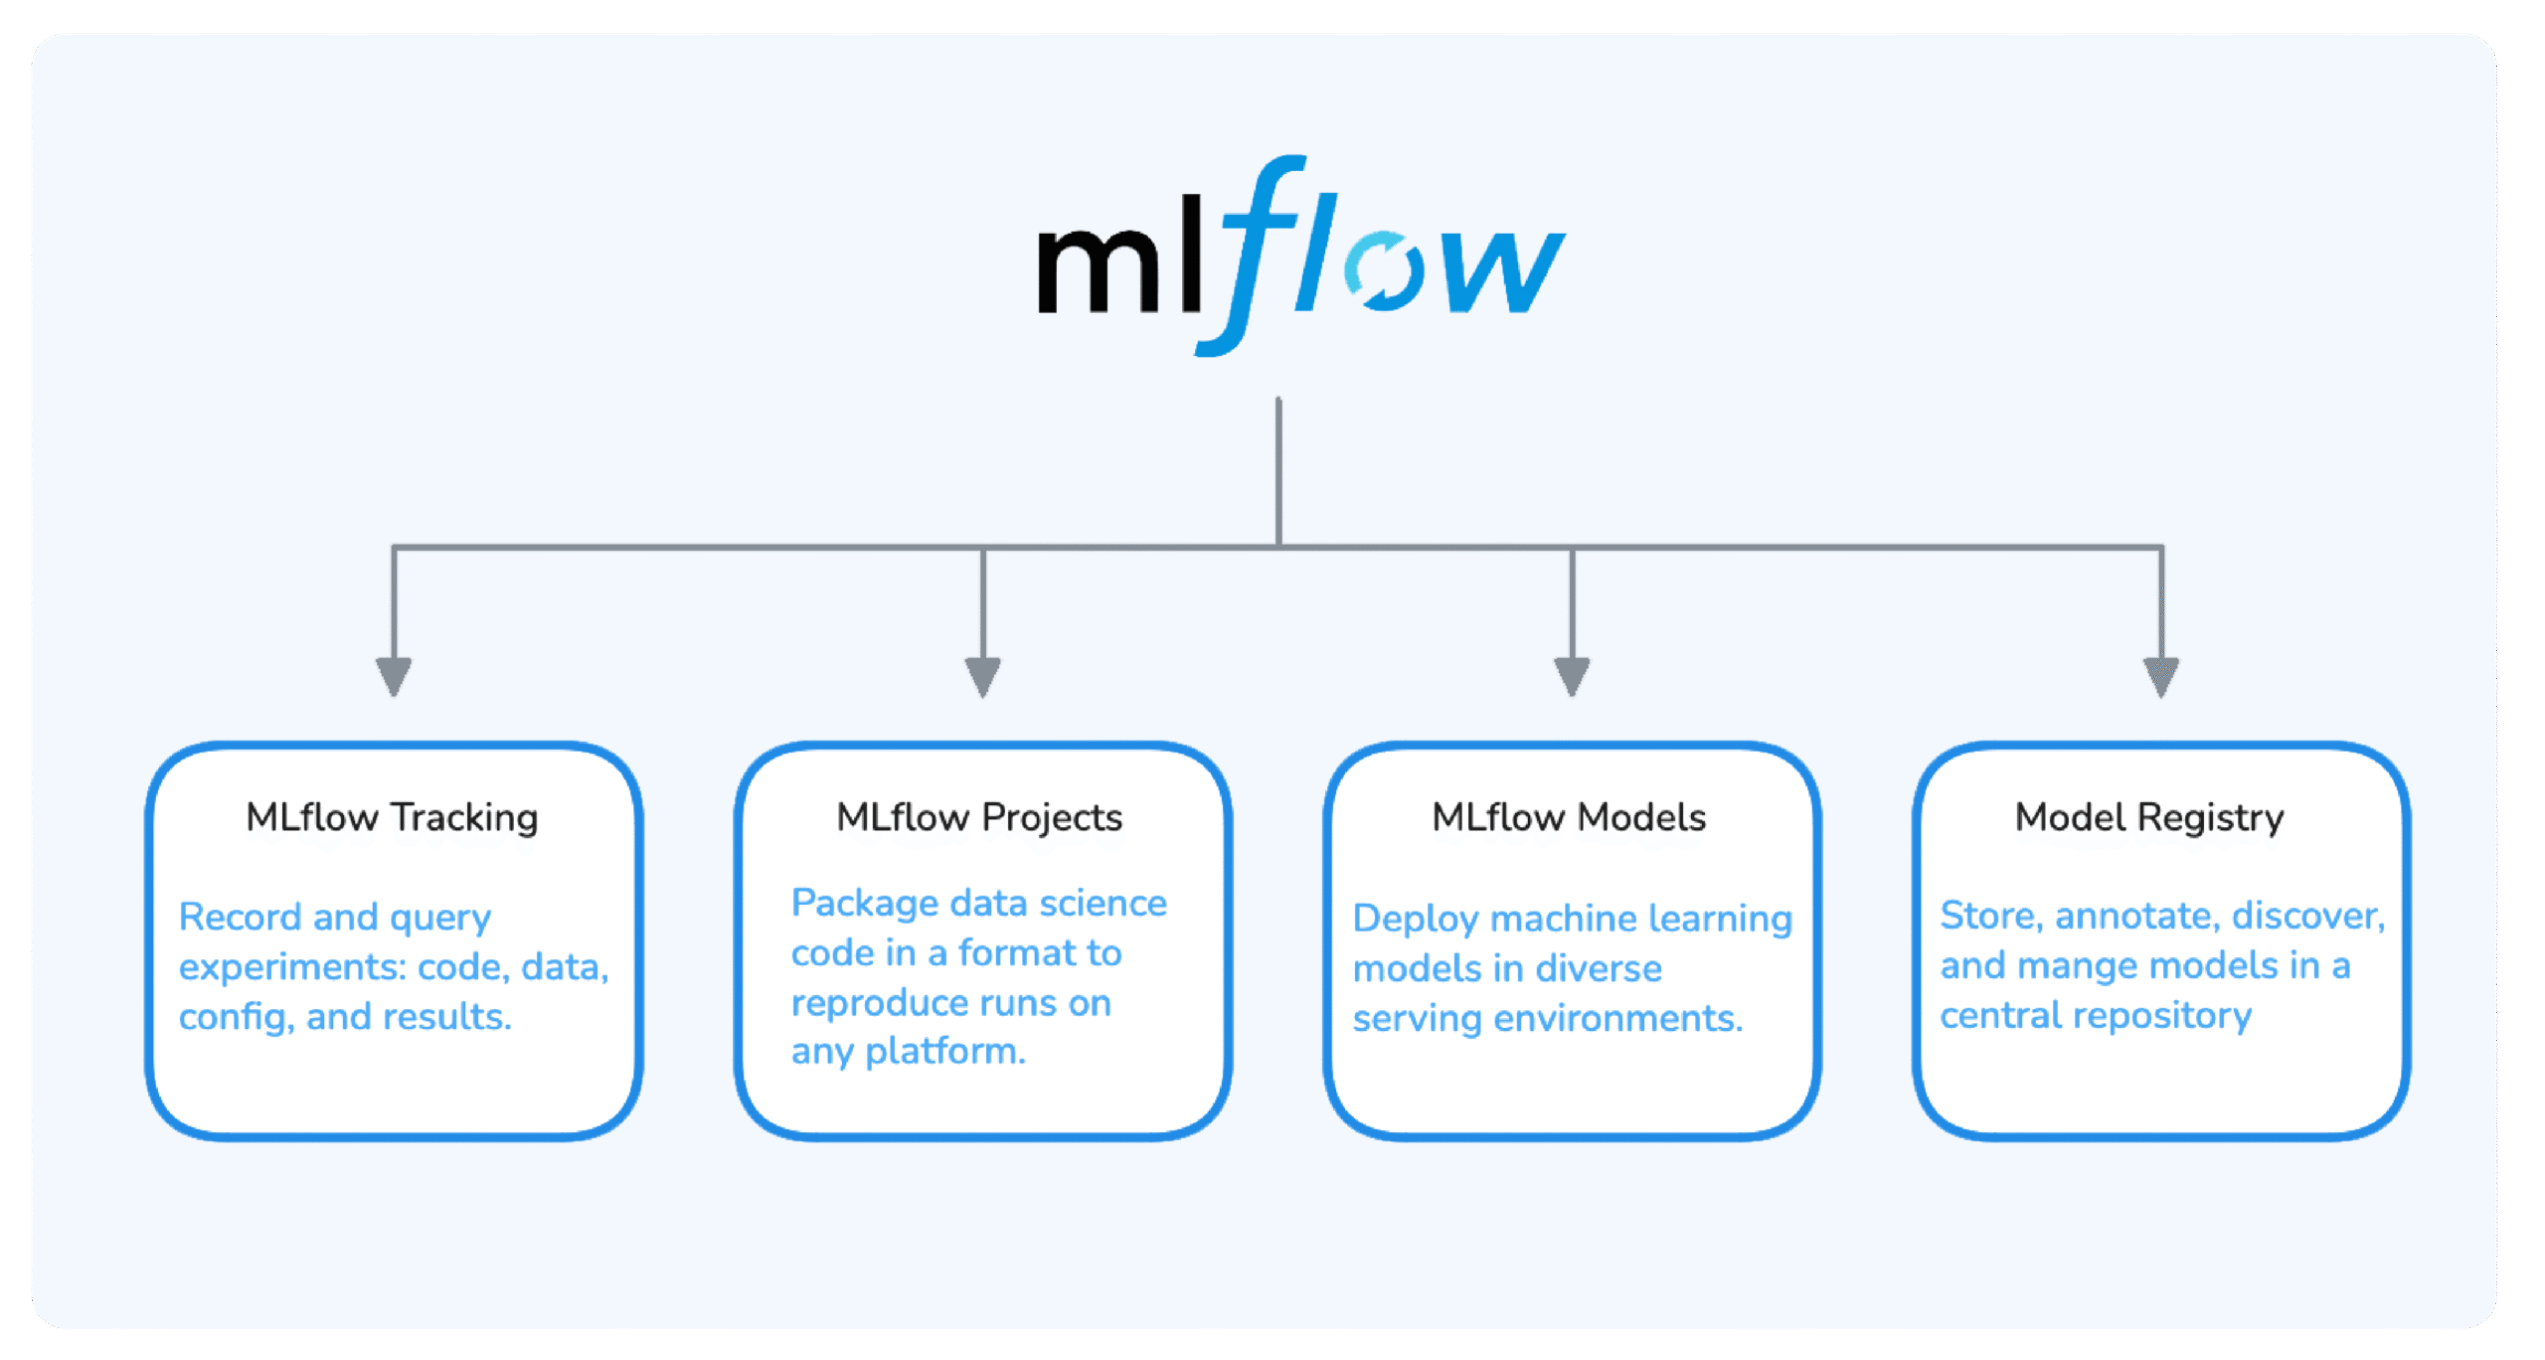
At its core, MLflow provides four main components:
- MLflow Tracking: An API designed for logging parameters, code versions, metrics, model environment dependencies, and model artifacts when running machine learning code. MLflow Tracking has a UI for reviewing and comparing runs and their results.
- MLflow Projects: A standardized format for packaging reusable data science code that can be executed with different parameters to train models, visualize data, or perform any other data science activities.
- MLflow Models: MLflow Models offers a universal format for packaging machine learning models, supporting a variety of frameworks such as Scikit-learn, TensorFlow, PyTorch, etc. These models can be deployed locally, to a REST API, or to cloud services.
- Model Registry: The Model Registry provides a central repository where models are versioned, annotated, and transitioned between lifecycle stages like Staging, Production, and QA.
MLflow integrates effortlessly with Python, Jupyter Notebooks, cloud storage (for example, GCP, AWS, Azure), and version control tools like Git and DVC. It can operate as a local service, a remote server, or be deployed within a Kubernetes cluster—supported by persistent volumes to ensure long-term storage of artifacts and logs.
In the context of a production MLOps system, MLflow serves as a single source of truth for model development and deployment. It enhances visibility across the team, ensures reproducibility of training runs, and streamlines the transition from experimentation to production. Whether tuning hyperparameters, retraining models due to data drift, or managing A/B testing of model versions, MLflow offers a flexible, extensible, and robust framework to handle it all.
Ultimately, MLflow transcends being merely a logging tool, it functions as the orchestrator of machine learning lifecycle management.
Training forecast model using Pandas
Model training represents a fundamental stage in the machine learning pipeline, during which a mathematical model identifies patterns within data to generate predictions or classifications. In Python, this process is frequently orchestrated using the Pandas library for data manipulation and preprocessing, along with a machine learning framework like Scikit-learn for constructing and assessing models. Pandas is particularly adept at loading, cleaning, transforming, and analyzing structured data, which is essential prior to the commencement of any training.
Generally, the process starts with loading data into a DataFrame through pd.read_csv() or similar methods. Subsequently, the data is examined and preprocessed, this may include addressing missing values, encoding categorical variables, normalizing numeric features, or filtering rows according to business logic. After preparation, the dataset is divided into features (X) and target (y), and further separated into training and testing sets (for instance, using train_test_split() from Scikit-learn). A machine learning model is then instantiated, trained on the training set, and validated against the test set. This allows the model to learn from historical data and be evaluated for accuracy, precision, recall, or other performance metrics. This modular, readable approach facilitated by Pandas and Scikit-learn empowers engineers to swiftly prototype, iterate, and evaluate models with clarity and control.
Time series forecasting entails the prediction of future values based on previously recorded data points over time. The Prophet library developed by Facebook, makes this process intuitive and powerful. When combined with Pandas, it facilitates a clean transition from raw data to actionable forecasts. The typical workflow commences with loading a dataset, such as mock_data.csv, into a Pandas DataFrame using pd.read_csv(). This file must include at least two essential columns: a timestamp (for instance, Date) and a metric (for instance, CPU usage, Memory, etc.) that is to be forecasted. Prophet requires the timestamp column to be named ds and the value column to be named y, necessitating a brief renaming step. After the data is adequately prepared, Prophet can be initialized and trained on the dataset. It employs an additive regression model that accounts for seasonality, trends, and optional holidays, resulting in a robust and interpretable forecasting model.
Check out the whole script explained below, here: generate predictions.py
For data manipulation pandas is used, pickle is used to save models to disk and Prophet is the time series forecasting model.
The data is loaded:
df = pd.read_csv("cloud_provider_mock_data.csv")
df["Date"] = pd.to_datetime(df["Date"], format="%d-%m-%Y")
Above snippet loads the dataset containing historical cloud provider data (in .csv format) and parses the Date column into datetime format.
We continue with providing metrics and the model:
metrics = [ ... ]A list of 19 cloud-related performance and business metrics, for instance revenue, market share, number of VMs, etc, which will be individually forecasted for each provider.
for provider in df["Provider"].unique():
    for metric in metrics:
Loop iterates over each unique provider (for instance, AWS, Azure, GCP) and each metric (for instance, Market Share (%), Revenue ($B), Growth Rate (%)).
metric_df = provider_df[["Date", metric]].rename(columns={"Date": "ds", metric: "y"})
model = Prophet()
model.fit(metric_df)
Data is formatted as (ds = date, y = value) and the model is trained for each provider–metric pair.
future = model.make_future_dataframe(periods=60, freq='M')
future = future[future["ds"] >= "2025-01-01"]
forecast = model.predict(future)
The model predicts monthly data for 60 periods (≈5 years), and only keeps data from January 2025 onward.
predictions = forecast[["ds", "yhat"]].rename(columns={"ds": "Date", "yhat": "Predicted Value"})
predictions["Provider"] = provider
predictions["Metric"] = metric
all_predictions.append(predictions)
The above snippet extracts the forecasted values and attaches provider and metric info, appending the results to a master list.
model_filename = "prophet_model.pkl"
with open(model_filename, "wb") as f:
    pickle.dump(model, f)
The last model is saved in .pkl format (which overwrites each time, so only one .pkl file remains).
final_df = pd.concat(all_predictions, ignore_index=True)
final_df.to_csv("cloud_provider_predictions.csv", index=False)
At the end all predictions are combined into one DataFrame and converted to a CSV file for downstream use (for instance, in dashboards or apps).
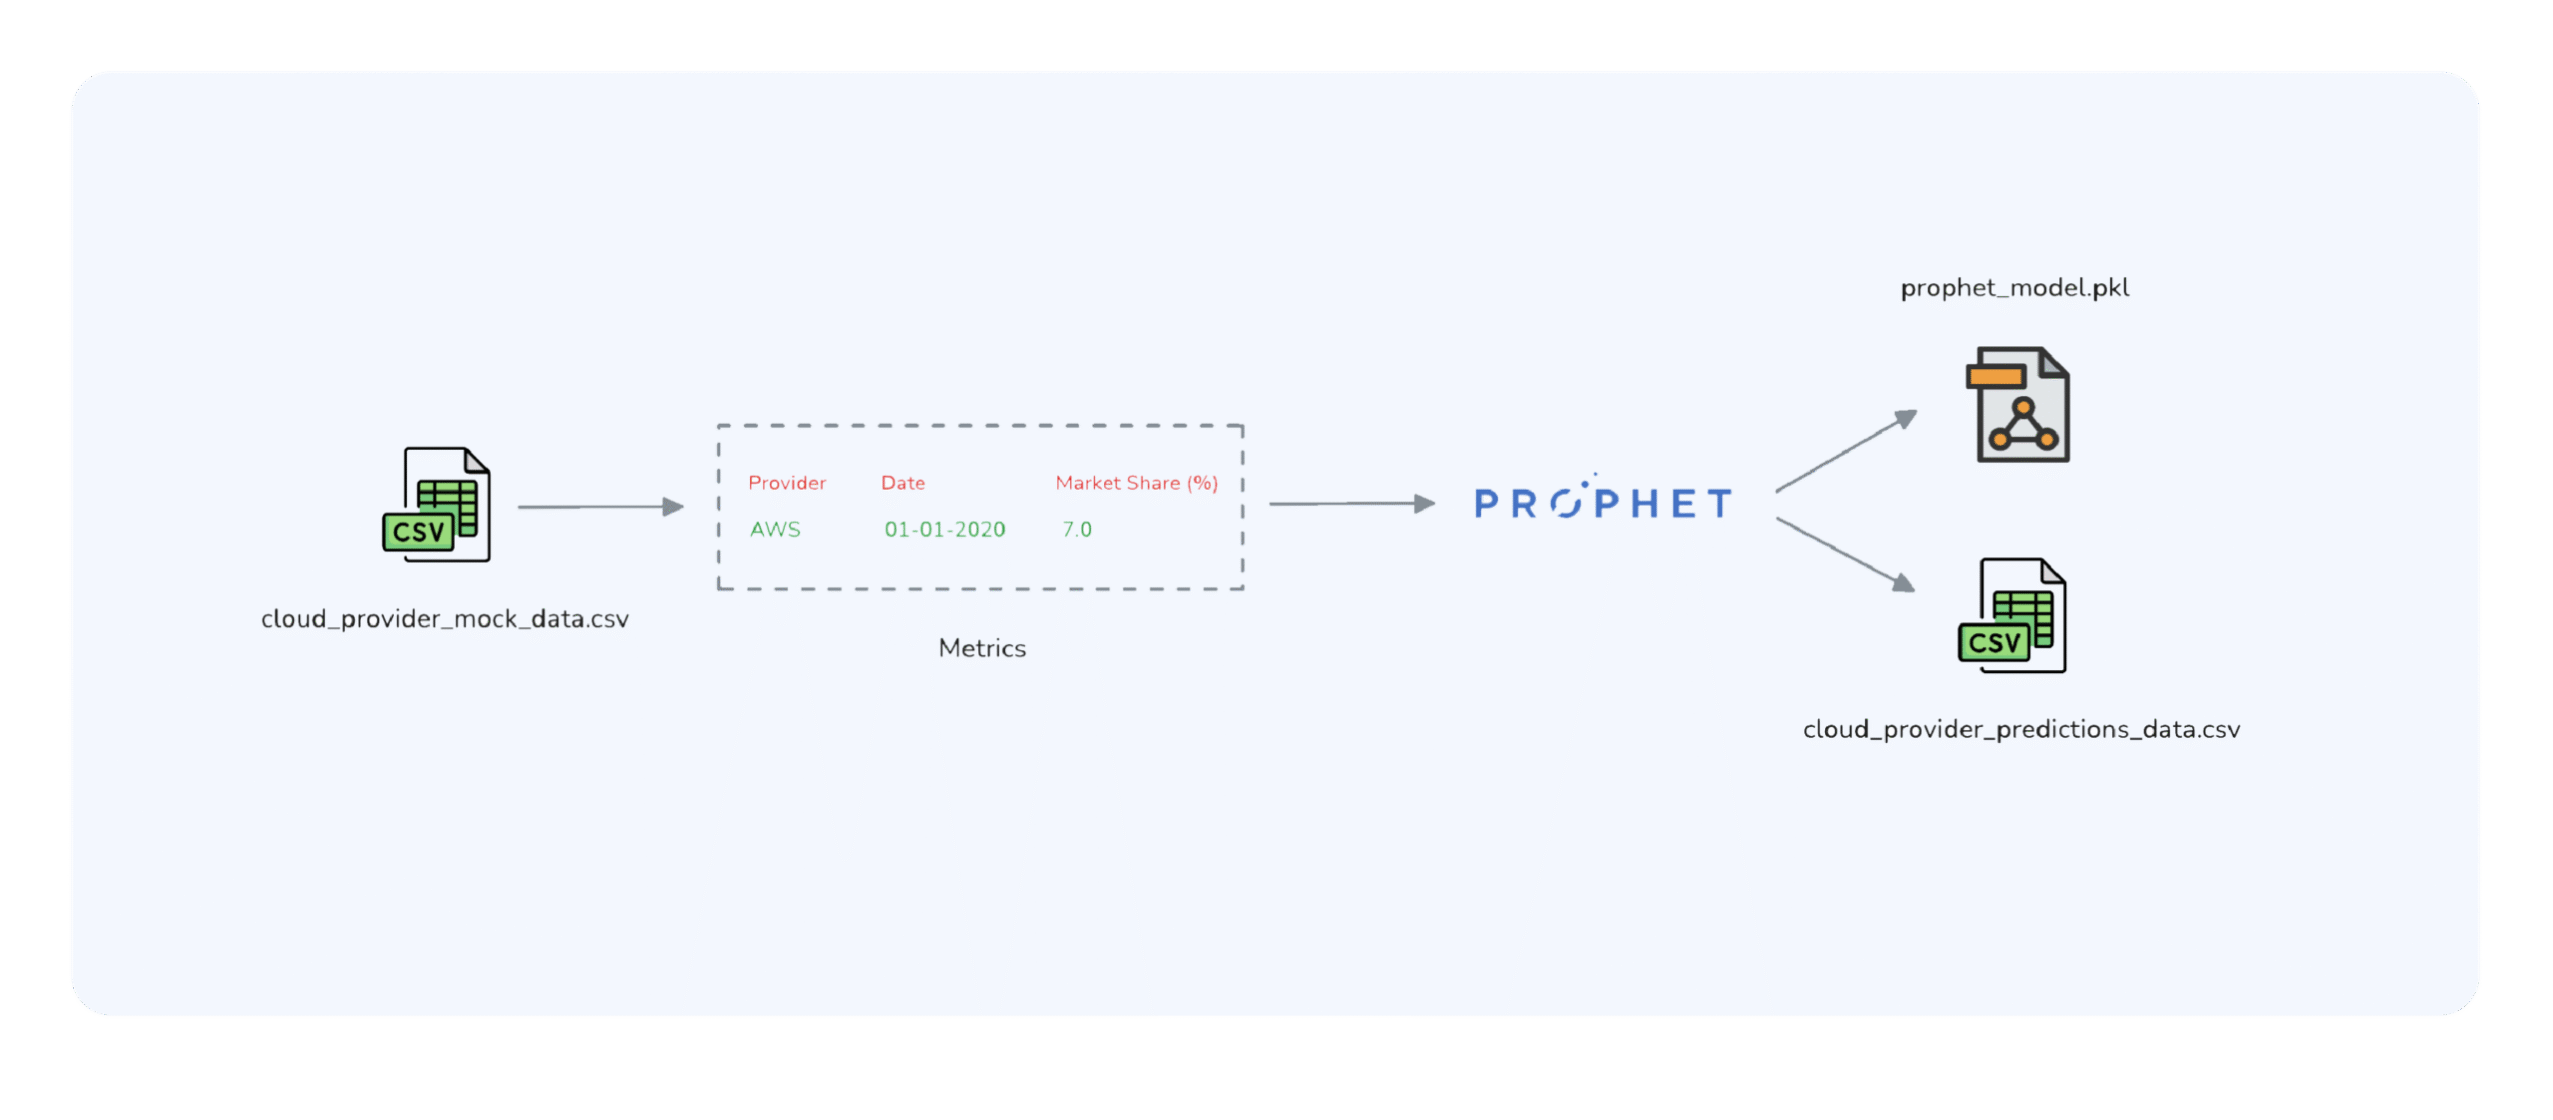
This script illustrates the complete process from data ingestion to model evaluation. Pandas is utilized to load and prepare the data, while Prophet manages the training and testing of the model. This modularity, along with Python’s clarity, renders this method one of the most efficient for small to medium-scale machine learning projects, educational purposes, or quick prototyping.
Logging data and metrics with MLflow
In the MLOps ecosystem, data and metrics are fundamental components for constructing, validating, and deploying effective machine learning systems.
Logging data artifacts with MLflow
Data encompasses the raw or processed information from which models derive insights, spanning historical logs, user interactions, time series data, images, and both structured and unstructured formats. High-quality, well-labeled, and versioned data is essential for training reliable models, since even minor inconsistencies or biases can drastically affect outcomes.
Within MLOps, data is regarded as a primary asset, necessitating rigorous version control, validation pipelines, lineage tracking, and governance. Tools such as MLflow are instrumental in this context, enabling the logging, tracking, and referencing of data artifacts (including .csv training datasets or preprocessed data) throughout the experiment lifecycle. This practice not only guarantees reproducibility but also enhances transparency regarding the specific data utilized for each model version.
Check the following Python code that exemplifies the effective use of MLflow for thorough data logging during an experiment or machine learning pipeline execution: mlflow_log_data.py
The script mentioned above monitors the data files utilized in the experiment, recording their size, shape, and sample contents. Additionally, it converts and saves files in various formats while incorporating comprehensive metadata to enhance reproducibility and discoverability. This methodology represents a best practice in MLOps, guaranteeing that all data dependencies are clear, version-controlled, and subject to auditing. It aids future users or team members in comprehending the data that was employed, its characteristics, and the processing methods applied, all accessible through the MLflow interface.
Metrics tracking with MLflow
Equally important are metrics, quantitative indicators that assess model performance (for instance, accuracy, precision, recall, etc.) or system health (for instance, latency, CPU usage). In MLOps, metrics play a vital role in model validation, ongoing monitoring, and initiating automated retraining or rollback processes.
MLflow facilitates detailed tracking of these metrics throughout experiments, recording them alongside parameters, code versions, and artifacts. This capability allows teams to compare model runs, visualize performance trends over time, and detect regressions or enhancements in a systematic, accessible manner. In addition to offline training, these metrics can be integrated with monitoring tools such as Prometheus and Grafana to observe live model performance in production, ensuring compliance with Service Level Agreements (SLAs) and enabling early identification of data drift or degradation. By closely linking data and metrics with experiment tracking, MLflow supports consistency, auditability, and efficiency throughout the entire machine learning lifecycle, rendering them essential components of a scalable and dependable MLOps pipeline.
Checkout the code: mlflow_log_metrics.py
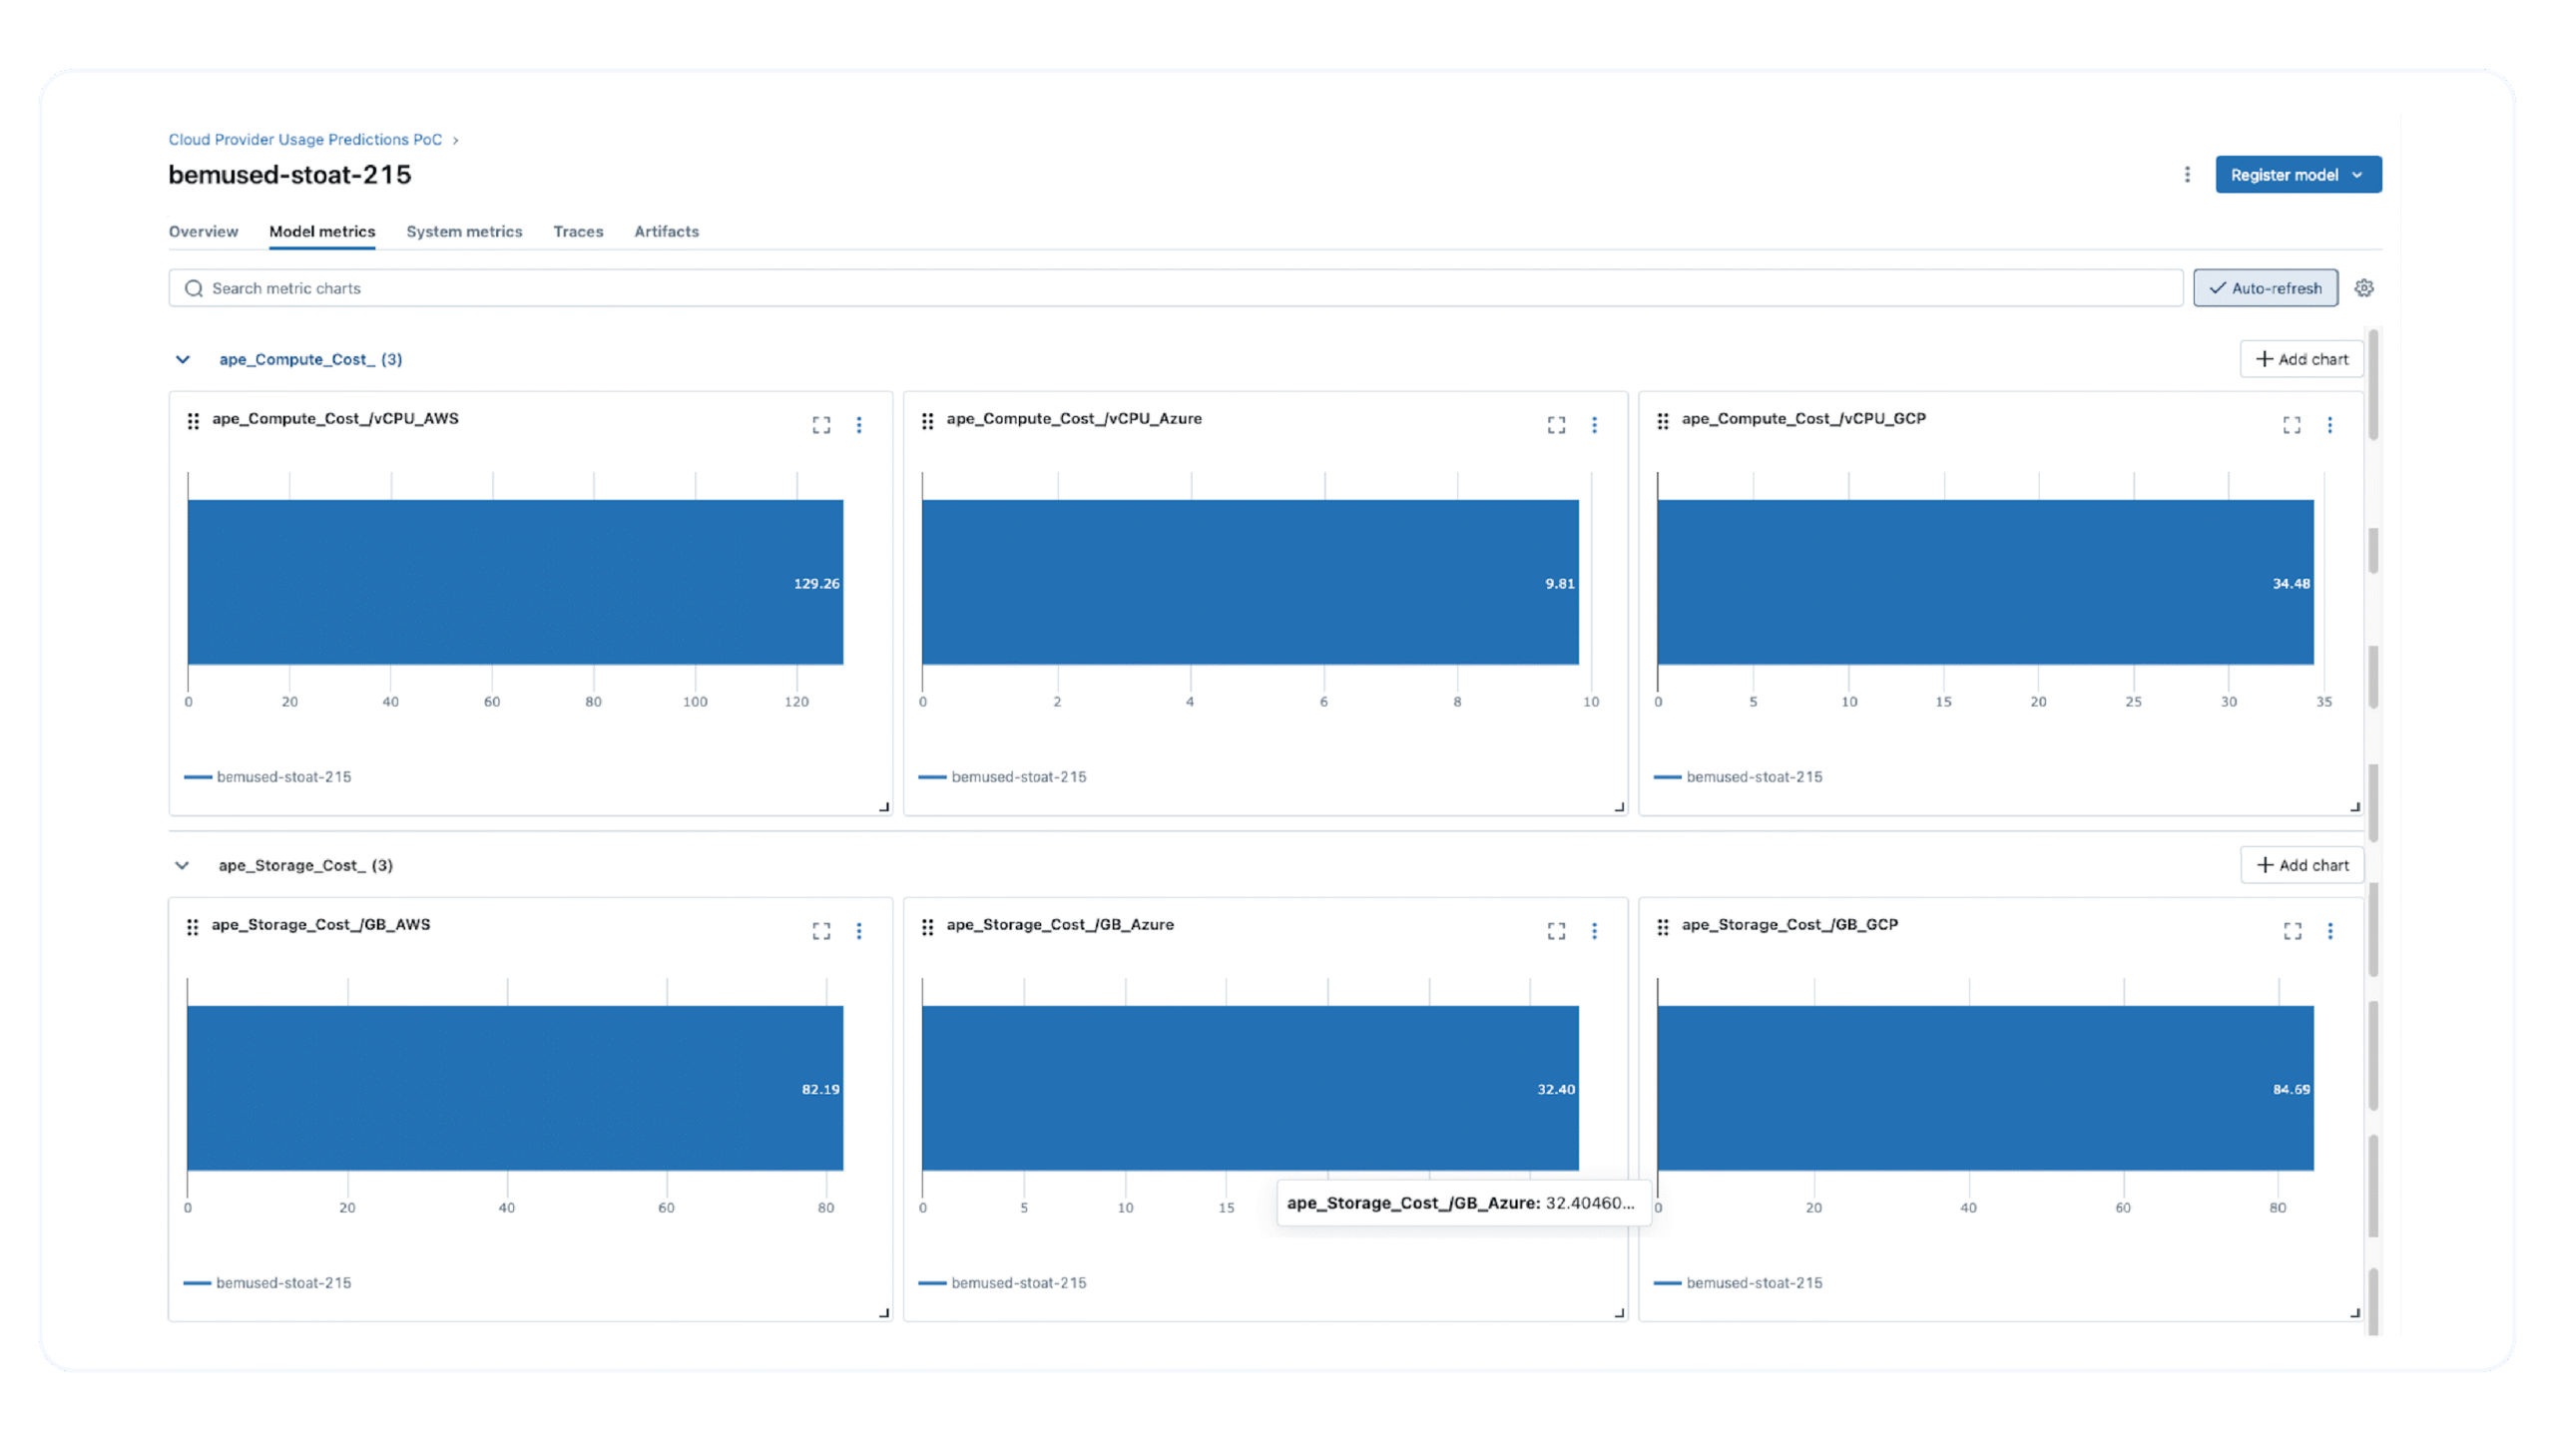
Linked Python script illustrates how to log domain-specific metrics into MLflow, utilizing structured simulated and prediction data related to cloud provider usage. It highlights several best practices in MLOps, such as tracking metrics, managing secure credentials, sanitizing inputs, and ensuring alignment of experiment structures across datasets.
By calculating and recording the difference between actual and predicted averages, the script offers a useful validation layer. The script integrates with an external MLflow server through environment-based authentication. By employing loops and dynamic naming, the same code can be easily adapted to other domains or datasets. It features modular name cleaning, informative logging, and condition checks to manage edge cases.
MLflow visualization charts:
This formula represents the prediction error as a percentage of the actual value, rendering it a standardized and comprehensible metric. A higher APE value signifies a greater deviation from the ground truth and, consequently, more pronounced indications of degradation. When monitored over time, a trend of rising APE across critical metrics can indicate the necessity for retraining or tuning.
Slack alerting is a technique for sending real-time notifications or messages to designated Slack channels or users when specific conditions are met within a system or application. In the context of machine learning, DevOps, or infrastructure monitoring, it serves as an essential communication link between automated systems and human operators.
This script exemplifies a practical and effective method for tracking model-relevant metrics within an MLOps workflow utilizing MLflow. It effectively bridges the divide between raw data analysis and production-level observability, ensuring that any discrepancies in predicted behavior can be monitored, logged, and addressed promptly.
Model degradation and alerting
Model degradation occurs when the performance of a machine learning model diminishes after it has been deployed, resulting in predictions that are less accurate compared to those made during the training phase. In simpler terms, once a model is put into operation, it faces the risk of making inaccurate predictions relative to its training. It is a misconception to believe that deploying a trained model signifies the conclusion of machine learning development. Machine learning models are often designed to process future, unknown data. As a model is evaluated against current datasets in rapidly evolving contexts, its predictive capabilities inevitably wane. This decline in accuracy contributes to the degradation of machine learning solutions.
The process of diminishing latent performance is referred to as model drift. Model drift illustrates how the relationship between input and output data evolves over time in unforeseen manners. Due to these changes, end-users perceive the model’s predictions for the same or similar data as having deteriorated. Essentially, model drift denotes a shift in the fundamental and often overlooked relationship between input and output variables. For instance, a model trained on synthetic data may find it challenging to adjust to new patterns, resulting in a reduction in predictive accuracy. Over time, this can lead to data degradation, where the quality and relevance of the input data no longer correspond with the model’s assumptions, further reducing its efficiency.
The consequences of degradation on machine learning performance are significant. As the model’s foundational assumptions become obsolete, its predictions become increasingly unreliable, often resulting in poor decision-making, inefficient use of resources, and adverse outcomes in critical applications. These problems can accumulate in the absence of proactive monitoring, ultimately rendering the model ineffective in production settings.
To address these challenges, organizations need to adopt strong monitoring and maintenance strategies. By consistently assessing performance and tackling data and model drift, teams can guarantee that their models stay accurate, relevant, and capable of providing value in ever-changing production environments. The advantages of monitoring model degradation encompass maintaining model reliability, upholding user trust, ensuring compliance with regulations, and facilitating proactive retraining workflows within MLOps pipelines. The absence of effective monitoring leads to increased error rates or misaligned outcomes that are only recognized after significant damage has occurred.
To measure model degradation, metrics such as APE (Absolute Percentage Error) are frequently utilized, and it can be calculated as:

Checkout following code: mlflow_data_degradation.py
This script implements a system for detecting model degradation, which assesses whether the predictive performance of a model has significantly diverged from the original data distribution, particularly concerning the Market Share (%) metric, and triggers an alert if it exceeds a predefined threshold.
Metrics and Artifact Tracking facilitate reproducibility and auditability through the use of MLflow, and given that the system is both modular and scalable, it can be readily adapted to accommodate additional metrics or models.
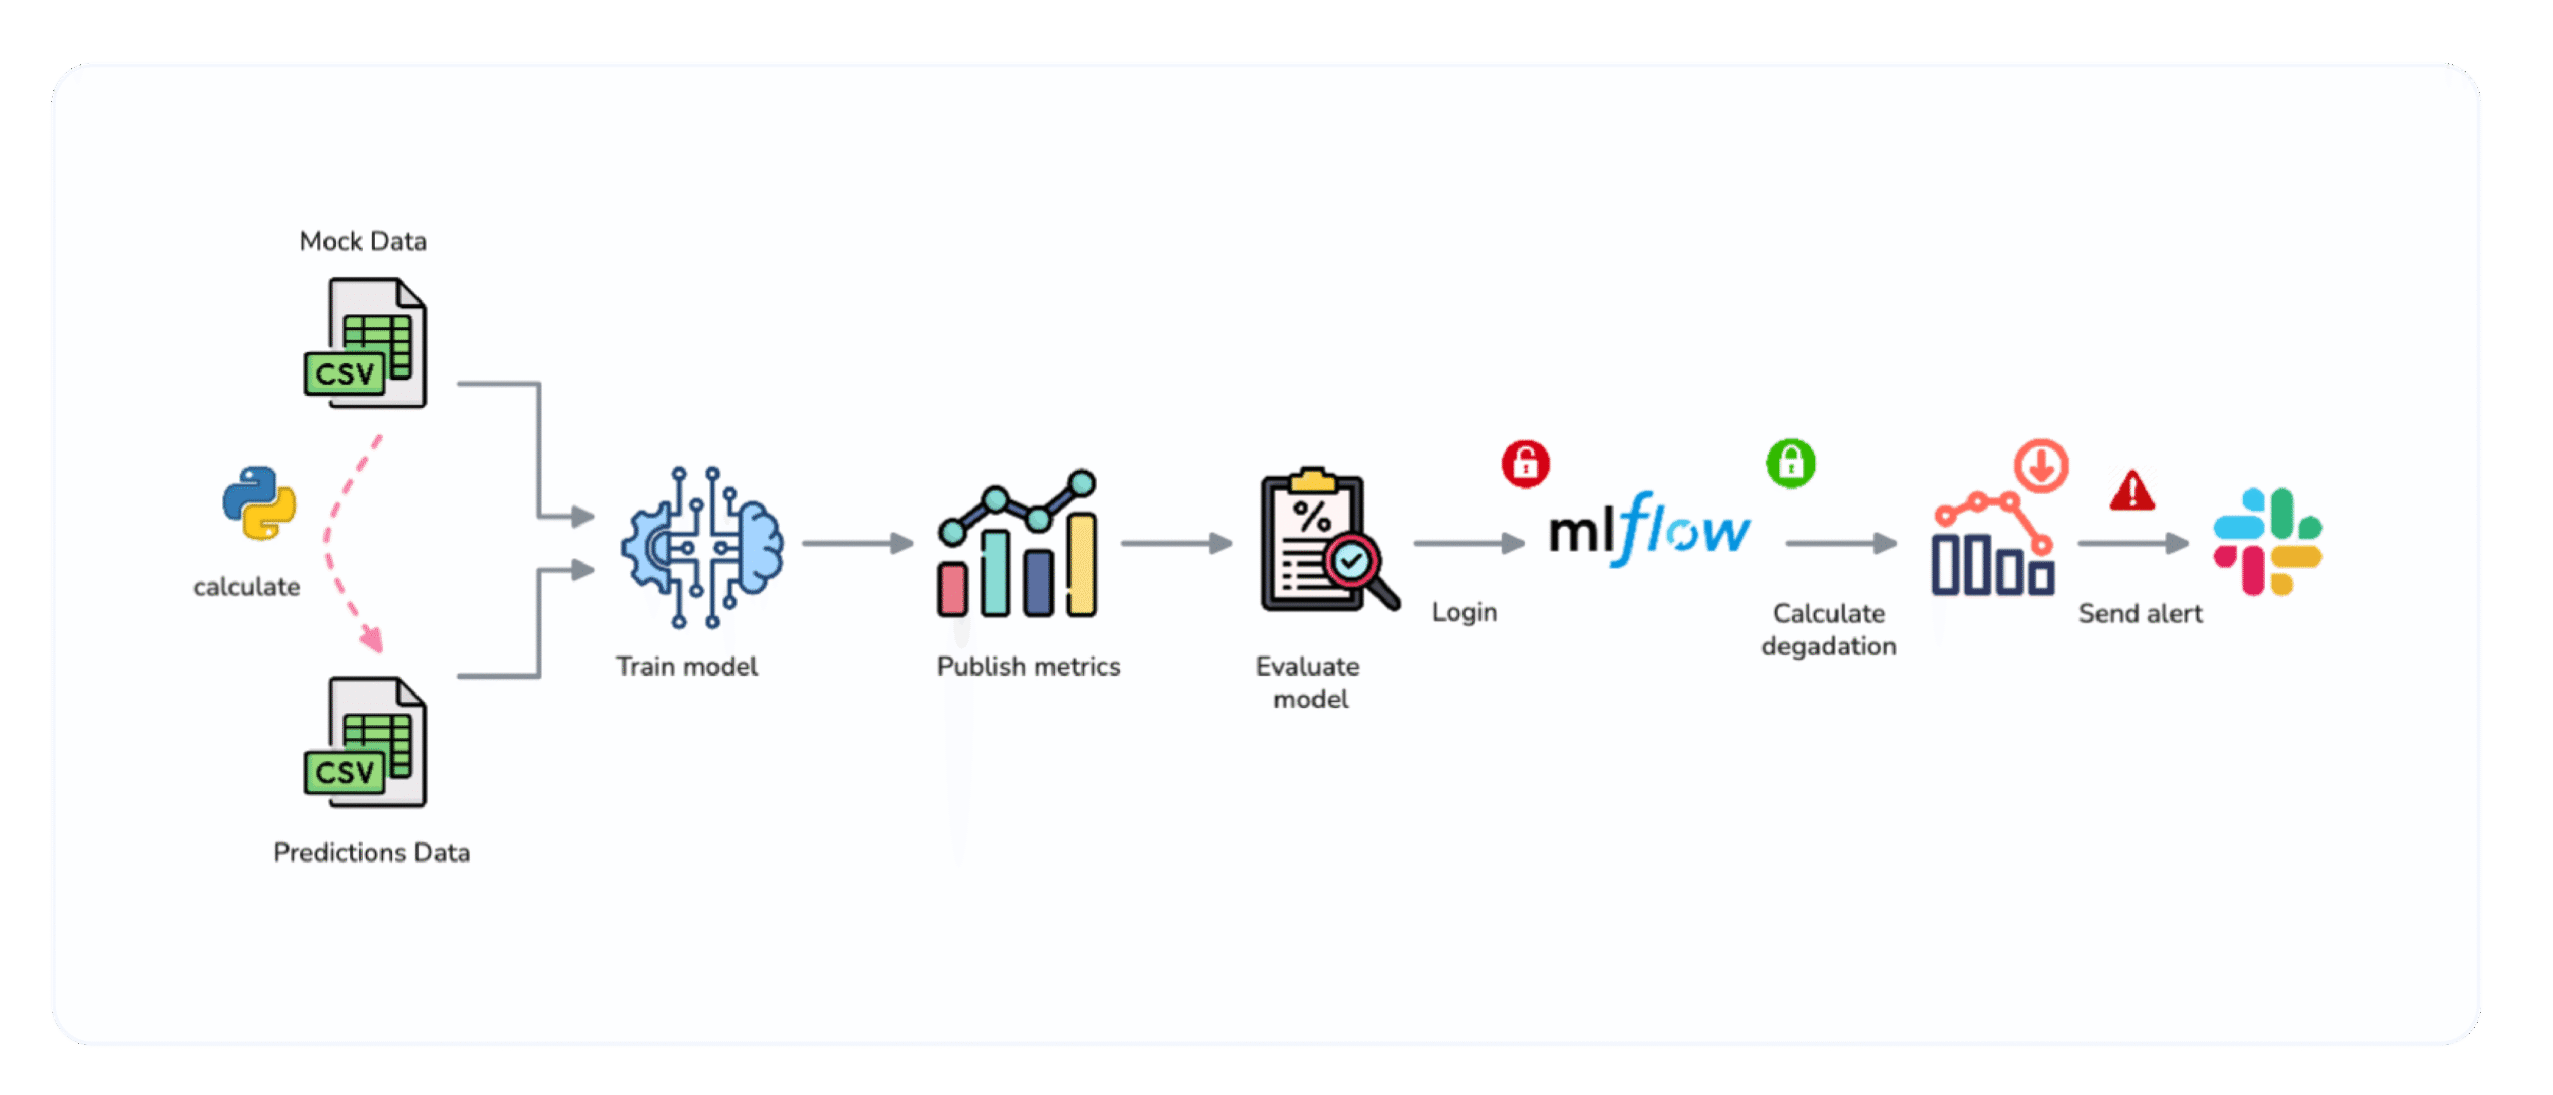
The above linked script serves as an illustration of effective MLOps practices, especially concerning model monitoring. By integrating checks for model degradation, logging, and alerting mechanisms, it contributes to the maintenance of the health and dependability of ML systems in a production environment. The application of metrics such as APE (Absolute Percentage Error) alongside tools like MLflow and Slack fosters a proactive stance on model governance, which is essential for any serious machine learning implementation. The Slack alerting system provides a streamlined and efficient method for keeping teams updated and responsive within intricate, automated settings.
Continuous integration and continuous deployment (CI/CD) automation
This GitHub Actions workflow streamlines the processes of building, publishing, and deploying a containerized Machine Learning PoC application to Google Kubernetes Engine (GKE). It is configured to operate either manually (through workflow_dispatch) or, should the comment be deleted, automatically with each push to the main branch.
Workflow Name and Trigger
name: Build & Deploy ML PoC App to GKE
on: [workflow_dispatch]
Field name is used to specify the name of the workflow, and field workflow_dispatch allows to manually trigger workflow from the GitHub UI. The commented section (push: branches: [main]) can be used to automatically trigger the workflow whenever changes are pushed to the main branch.
These variables are reused throughout the workflow and include:
- ARTIFACT_REGISTRY_TOKEN: Secret for authenticating with Google Cloud.
- PROJECT_ID, INVENTORY_ID: Identifiers for GCP resources.
- GKE_CLUSTER, GKE_ZONE: Identifies the Kubernetes cluster to deploy to.
- NAMESPACE, DEPLOYMENT_NAME: Specifies the target namespace and deployment in GKE.
- DOCKER_REGISTRY, IMAGE_NAME, IMAGE_TAG: Define where the Docker image will be stored and tagged.
CONTAINER_NAME: Logical name of the container within the deployment.
Important
Secrets (${{ secrets.\* }}) are configured in GitHub Repository Settings → Secrets and variables → Actions. Variables GAR_SA_KEY and GKE_SA_KEY can be added there as encrypted JSON strings from the Google Cloud IAM service account keys.
runs-on: ubuntu-latestVariable runs-on specifies that the job will be performed on the GitHub Actions built-in runner.
- uses: docker/setup-qemu-action@v1
- uses: docker/setup-buildx-action@v1
The above code snippet enables cross-platform builds with BuildKit.
- uses: actions/checkout@v3The line defined above is used to pull the repository contents into the runner.
- uses: google-github-actions/[email protected]
  with:
    service_account_key: ${{ secrets.GAR_SA_KEY }}
    project_id: ${{ env.PROJECT_ID }}
    export_default_credentials: true
Above code snippet authenticates the runner to Google Cloud and specifies GCP project, by using environment variables and secrets.
- name: Build Docker image
  run: docker build -t $IMAGE_NAME:$IMAGE_TAG .
Command specified in the run variable builds the Docker image locally with the defined tag.
- run: gcloud --quiet auth configure-docker europe-west3-docker.pkg.devThe above command configures Docker to push to GCP’s Artifact Registry.
- run: |
    docker tag $IMAGE_NAME:$IMAGE_TAG $DOCKER_REGISTRY/$IMAGE_NAME:$IMAGE_TAG
    docker push $DOCKER_REGISTRY/$IMAGE_NAME:$IMAGE_TAG
Above code snippet allows to tag Docker image, and push to defined GCP Artifact Registry.
- uses: google-github-actions/[email protected]
  with:
    cluster_name: ${{ env.GKE_CLUSTER }}
    location: ${{ env.GKE_ZONE }}
    credentials: ${{ secrets.GKE_SA_KEY }}
Above code snippet uses GKE_SA_KEY secret to authenticate and obtain cluster credentials for kubectl.
- run: |
    kubectl rollout restart deployment/$DEPLOYMENT_NAME -n $NAMESPACE
    kubectl get deployments -o wide -n $NAMESPACE
Instead of applying manifests, the above code snippet simply restarts the deployment to pull the updated image.
This GitHub Actions workflow facilitates a fully automated CI/CD pipeline for containerized applications deployed on GCP through GKE. It constructs and uploads Docker image to the Artifact Registry, authenticates to Google Cloud Platform utilizing service account keys, employs kubectl to refresh the Kubernetes deployment with the updated image, and maintains deployment security and manageability through secrets and automation. This configuration represents a robust and scalable approach to managing cloud-native ML application deployments.
Deep dive into the MLflow workflow
This GitHub Actions workflow is crafted to automate the execution of an MLflow pipeline, enabling users to run it manually or schedule it at regular intervals (for instance, monthly). It establishes environment variables using secrets, prepares the required Python environment, installs dependencies, and ultimately runs a Python script that encompasses MLflow logic.
name: Run MLflow Workflow
on: [workflow_dispatch]
The name field is used to specify the name of the workflow. It is manually triggered using workflow_dispatch. The commented cron expression (‘0 0 1 * *‘) suggests the workflow can be scheduled to run automatically on the 1st of every month at midnight, if needed.
env:
  MLFLOW_USERNAME: ${{ secrets.MLFLOW_USERNAME }}
  MLFLOW_PASSWORD: ${{ secrets.MLFLOW_PASSWORD }}
  SLACK_WEBHOOK_URL: ${{ secrets.SLACK_WEBHOOK_URL }}
These environment variables are injected into the job’s environment:
- MLFLOW_USERNAME, MLFLOW_PASSWORD: Used for authenticating with the MLflow tracking server.
- SLACK_WEBHOOK_URL: Used to send alerts or notifications (for instance, degradation alerts) from the pipeline to Slack.
ⓘ Note: These values (MLFLOW_USERNAME, MLFLOW_PASSWORD and SLACK_WEBHOOK_URL) are securely stored in the repository’s GitHub Secrets.
jobs:
  build-deploy:
    name: Build and Deploy MLflow Pipeline
    runs-on: ubuntu-latest
A job named “Build and Deploy MLflow Pipeline” runs on the latest Ubuntu runner.
- uses: actions/checkout@v3Clones the repository so that the workflow has access to files and codebase.
- uses: actions/setup-python@v4
  with:
    python-version: '3.10'
Above code snippet installs and sets Python version “3.10” on the GitHub runner.
- run: |
    python -m pip install --upgrade pip
    pip install pandas prophet mlflow scikit-learn requests
Required Python packages are installed using pip.
- run: python mlflow/scripts/mlflow_workflow.pyExecutes the main MLflow workflow script, which loads and processes data, trains a forecasting model, logs parameters, metrics, and artifacts to MLflow and checks for model degradation and sends Slack alerts.
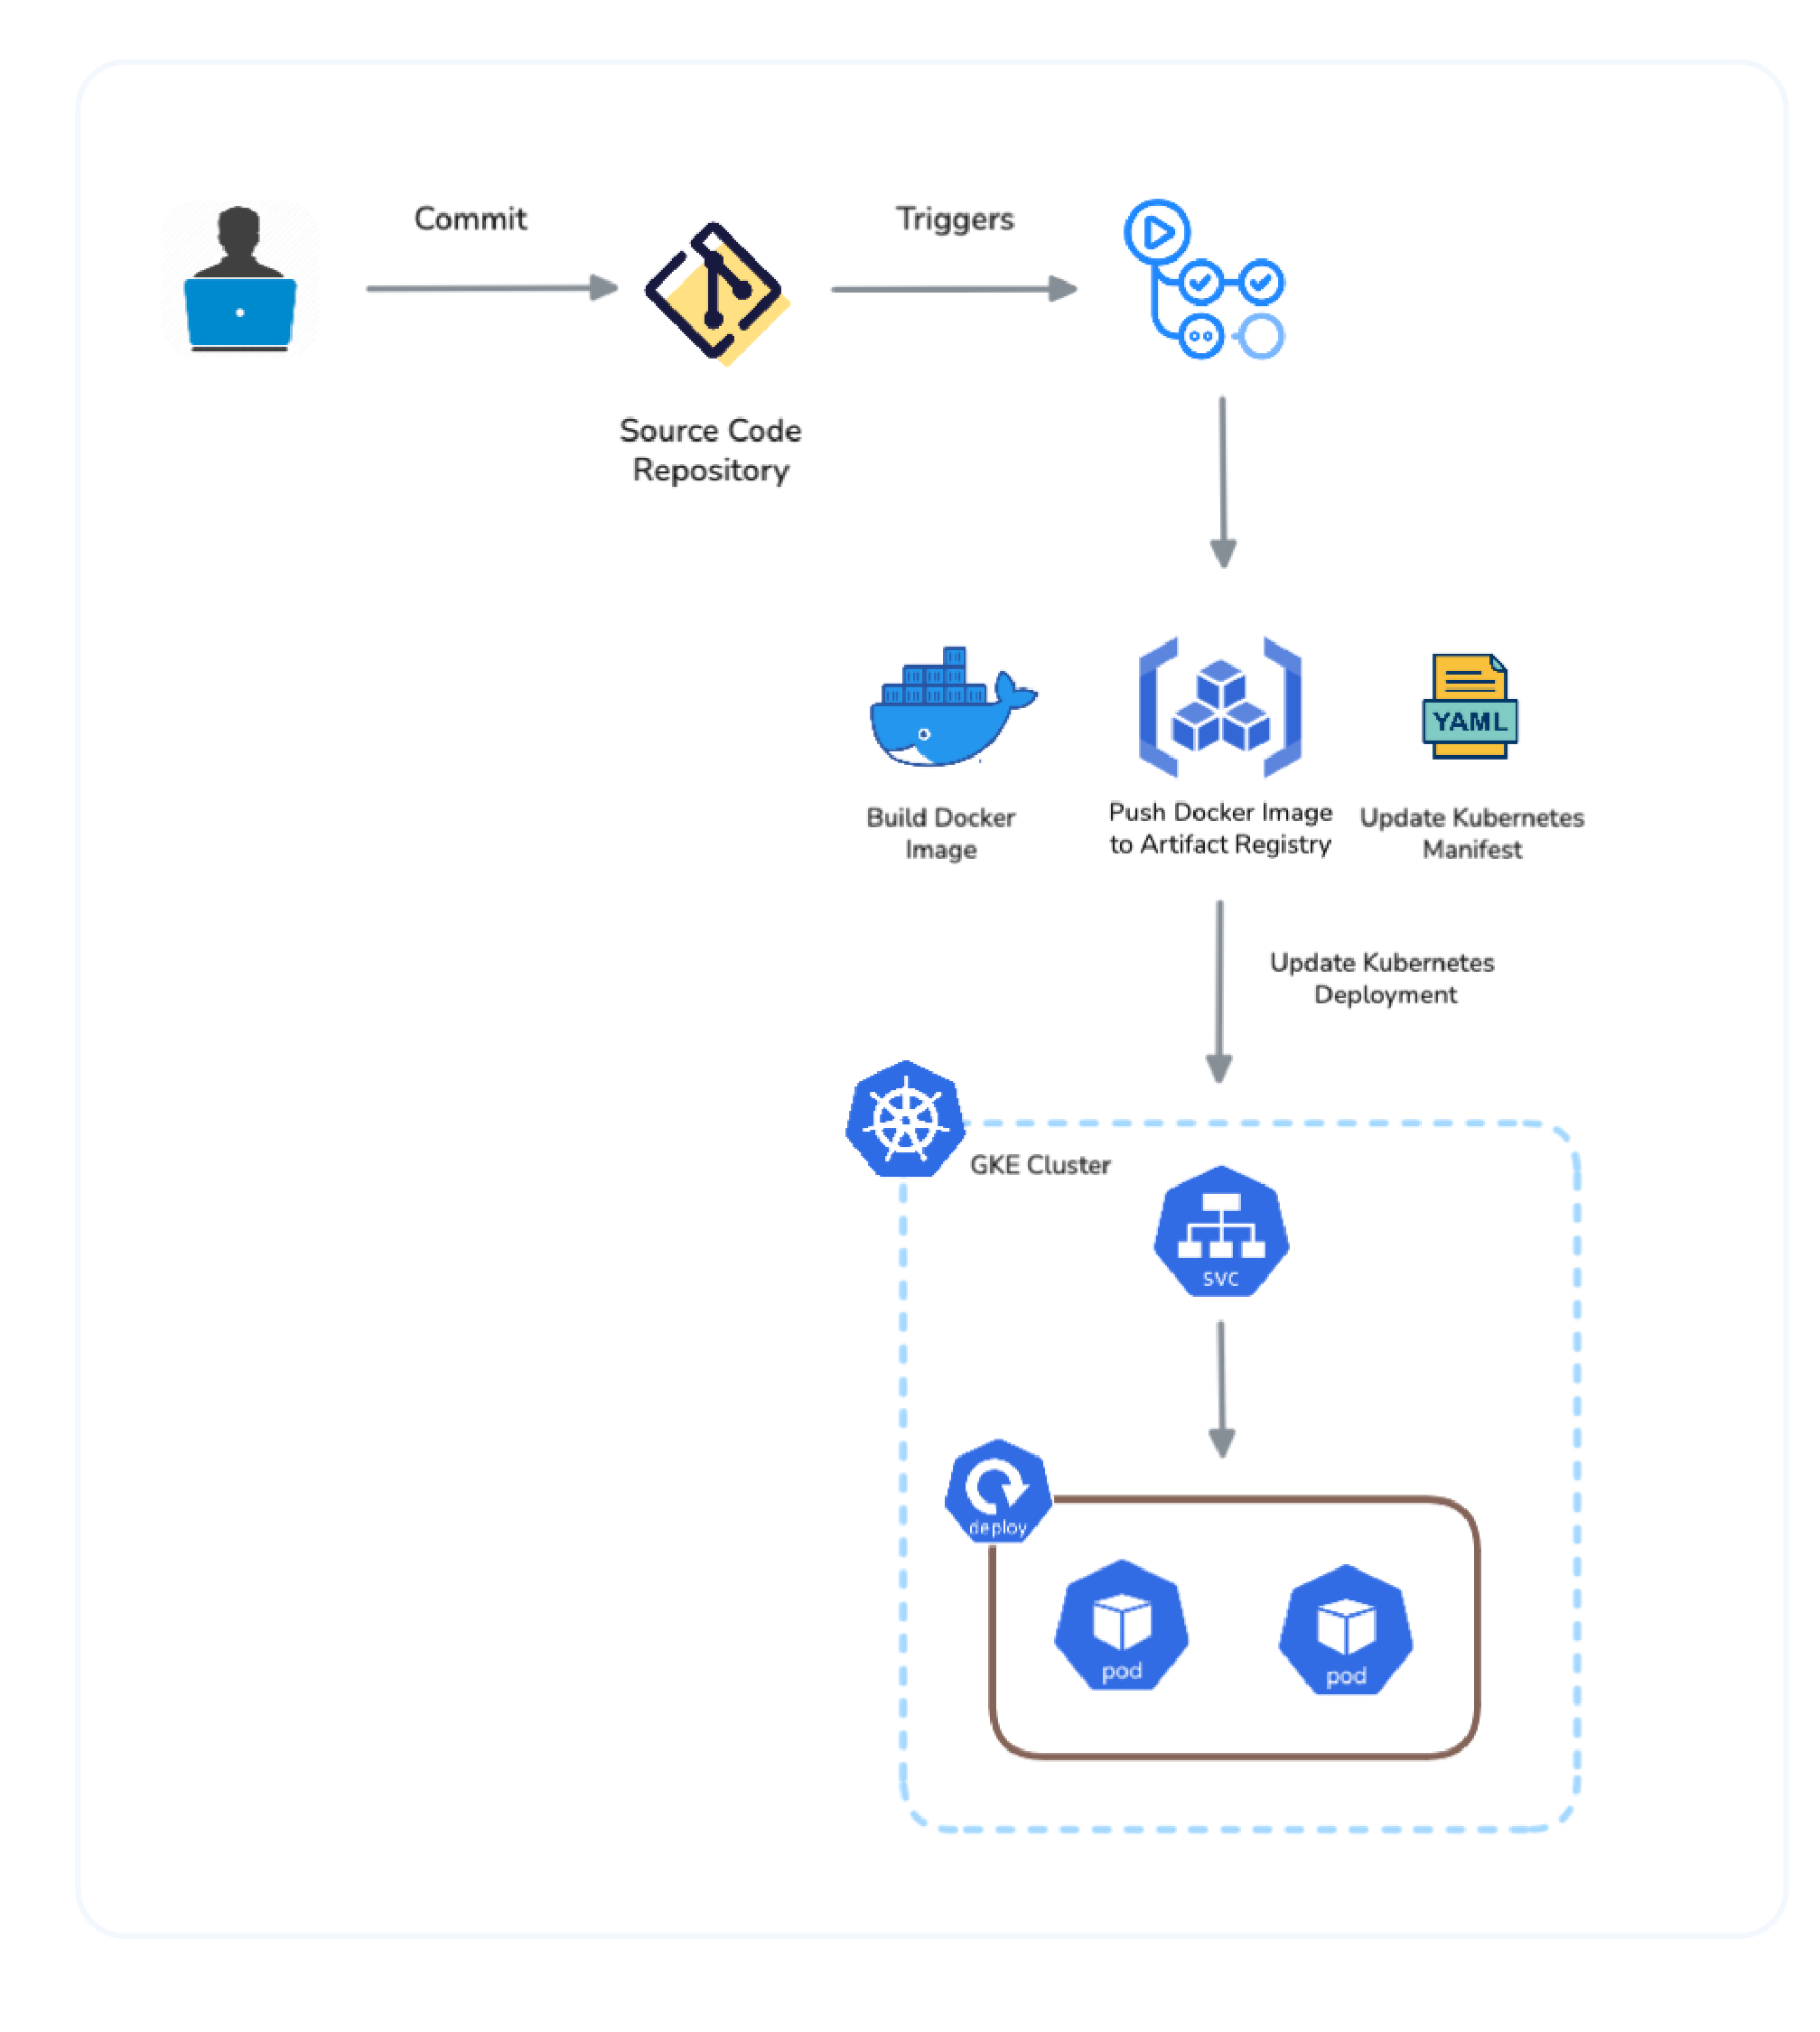
This GitHub Actions workflow acts as a streamlined CI/CD pipeline for tracking and monitoring ML models with MLflow. It guarantees the automation of model training and logging, secure management of credentials, integration with Slack for real-time notifications, and offers reusability and scalability within any MLOps pipeline. It streamlines repeatable ML operations and improves reliability throughout the stages of the model lifecycle.
Secret and Credential Management for Secure Pipelines
Secrets and credential management in GitHub is a critical aspect of maintaining the security and integrity of modern CI/CD workflows, particularly during application deployment or when interfacing with cloud services and external APIs.
GitHub offers a secure mechanism for storing sensitive data, such as API keys, passwords, access tokens, and service account credentials, through GitHub Secrets. These secrets are encrypted while stored and are only accessible to workflows operating within the same repository or organization, guaranteeing that they are never saved in plaintext or revealed in logs. In a GitHub Actions workflow, secrets can be accessed using the ${{ secrets.SECRET_NAME }} syntax and are injected into the runtime environment as environment variables, enabling scripts to authenticate with external services without embedding credentials directly in the repository.
Scalability and Future Improvements
As MLOps systems evolve from proof-of-concept (PoC) pipelines to production-level workflows, scalability and extensibility emerge as critical foundations for sustained success and tangible impact in real-world applications. The existing MLOps framework, utilizing tools such as MLflow for experiment tracking, Prophet for forecasting, Prometheus and Grafana for monitoring, GitHub Actions for CI/CD, and Kubernetes for orchestration, offers a robust and modular base. Nevertheless, enhancing this architecture to accommodate enterprise-level workloads or varied use cases across teams necessitates several vital improvements and upgrades.
Advanced Drift Detection
Although degradation detection based on average values is sufficient for simple scenarios, advanced drift detection methodologies yield more profound insights into subtle variations in input data distribution (data drift) or the relationship between features and the target variable (concept drift). Tools such as Evidently.ai, WhyLabs, or Fiddler AI can be integrated into the existing pipeline to monitor the statistical characteristics of the data over time. The implementation of this would facilitate proactive monitoring of changes in input distributions and the identification of shifts before they adversely affect model performance, thereby allowing for preemptive retraining and minimizing downtime.
Multi-model Support
A further significant enhancement for scalability is the introduction of multi-model support. As teams grow and use cases diversify, it is common to oversee dozens or even hundreds of models serving distinct functions, some for batch processing and others for real-time applications. While MLflow already accommodates multiple experiments and models, the system should be structured to manage versioned models, stage transitions (for instance, Staging → Production), and even A/B testing or canary deployments. The MLflow model registry can be augmented to utilize model serving layers (such as Seldon Core or KServe) within Kubernetes to simultaneously manage multiple deployed models, routed through NGINX or Kong Ingress controller.
Horizontal Scaling and Resource Optimization
To address the demands of real-world traffic or inference, the current Horizontal Pod Autoscalers (HPA), resource limits, and node affinity rules utilized in Kubernetes deployments can be further refined to enhance performance and reduce costs. For example, depending on the input data size or the complexity of the forecasting model, Pods can automatically scale out based on CPU or memory metrics collected by Prometheus. Additionally, Persistent Volumes (PVs) supported by GCP Disks can be dynamically provisioned using StorageClasses to ensure flexibility in data availability and model artifacts.
Secure and Auditable Model Lifecycle
As MLOps expands, the importance of security and auditability increases significantly. The implementation of Role-Based Access Control (RBAC) within Kubernetes, along with the secure management of credentials through cloud-native secret managers, guarantees data protection and compliance. Furthermore, tagging runs and logging parameters and artifacts in MLflow, as has already been established, creates an immutable audit trail for every model version and deployment.
Extending CI/CD Workflows
The workflows in GitHub Actions can be enhanced for scalability by incorporating matrix builds to test various Python versions or model parameters, establishing test and validation stages prior to deployment (for instance, executing unit tests or model performance evaluations), scheduling regular jobs (such as daily or weekly retraining) using cron syntax, and dynamically tagging Docker images based on GitHub tags or commit hashes to improve traceability.
Example Scenario
The cloud provider usage forecasting system has been deployed into production. As time progresses, usage patterns evolve as businesses expand or integrate new cloud services. The model that was initially defined and accurate is now failing to perform adequately. Prometheus identifies a growing discrepancy between the predicted and actual usage, subsequently sending an alert through Alertmanager. This action initiates a GitHub Action that automatically retrieves the most recent data, retrains the model utilizing Prophet and Pandas, records new metrics in MLflow, and redeploys the revised model to GKE—all without any manual input.
Conclusion
This article and MLOps Proof of Concept repository serves as a guide and a blueprint for modern MLOps implementation. It provides automation, transparency, and observability at every stage of the machine learning lifecycle.
In conclusion, scaling the MLOps system requires transitioning from isolated tools to the development of a cohesive, automated ecosystem. By establishing retraining triggers, enhancing drift detection, accommodating multiple models, intelligently scaling infrastructure, and refining CI/CD workflows, the current platform can effectively manage real-world complexities while maintaining reliability, traceability, and performance. These improvements not only equip the system for future expansion but also reinforce its resilience in ever-changing production settings.


